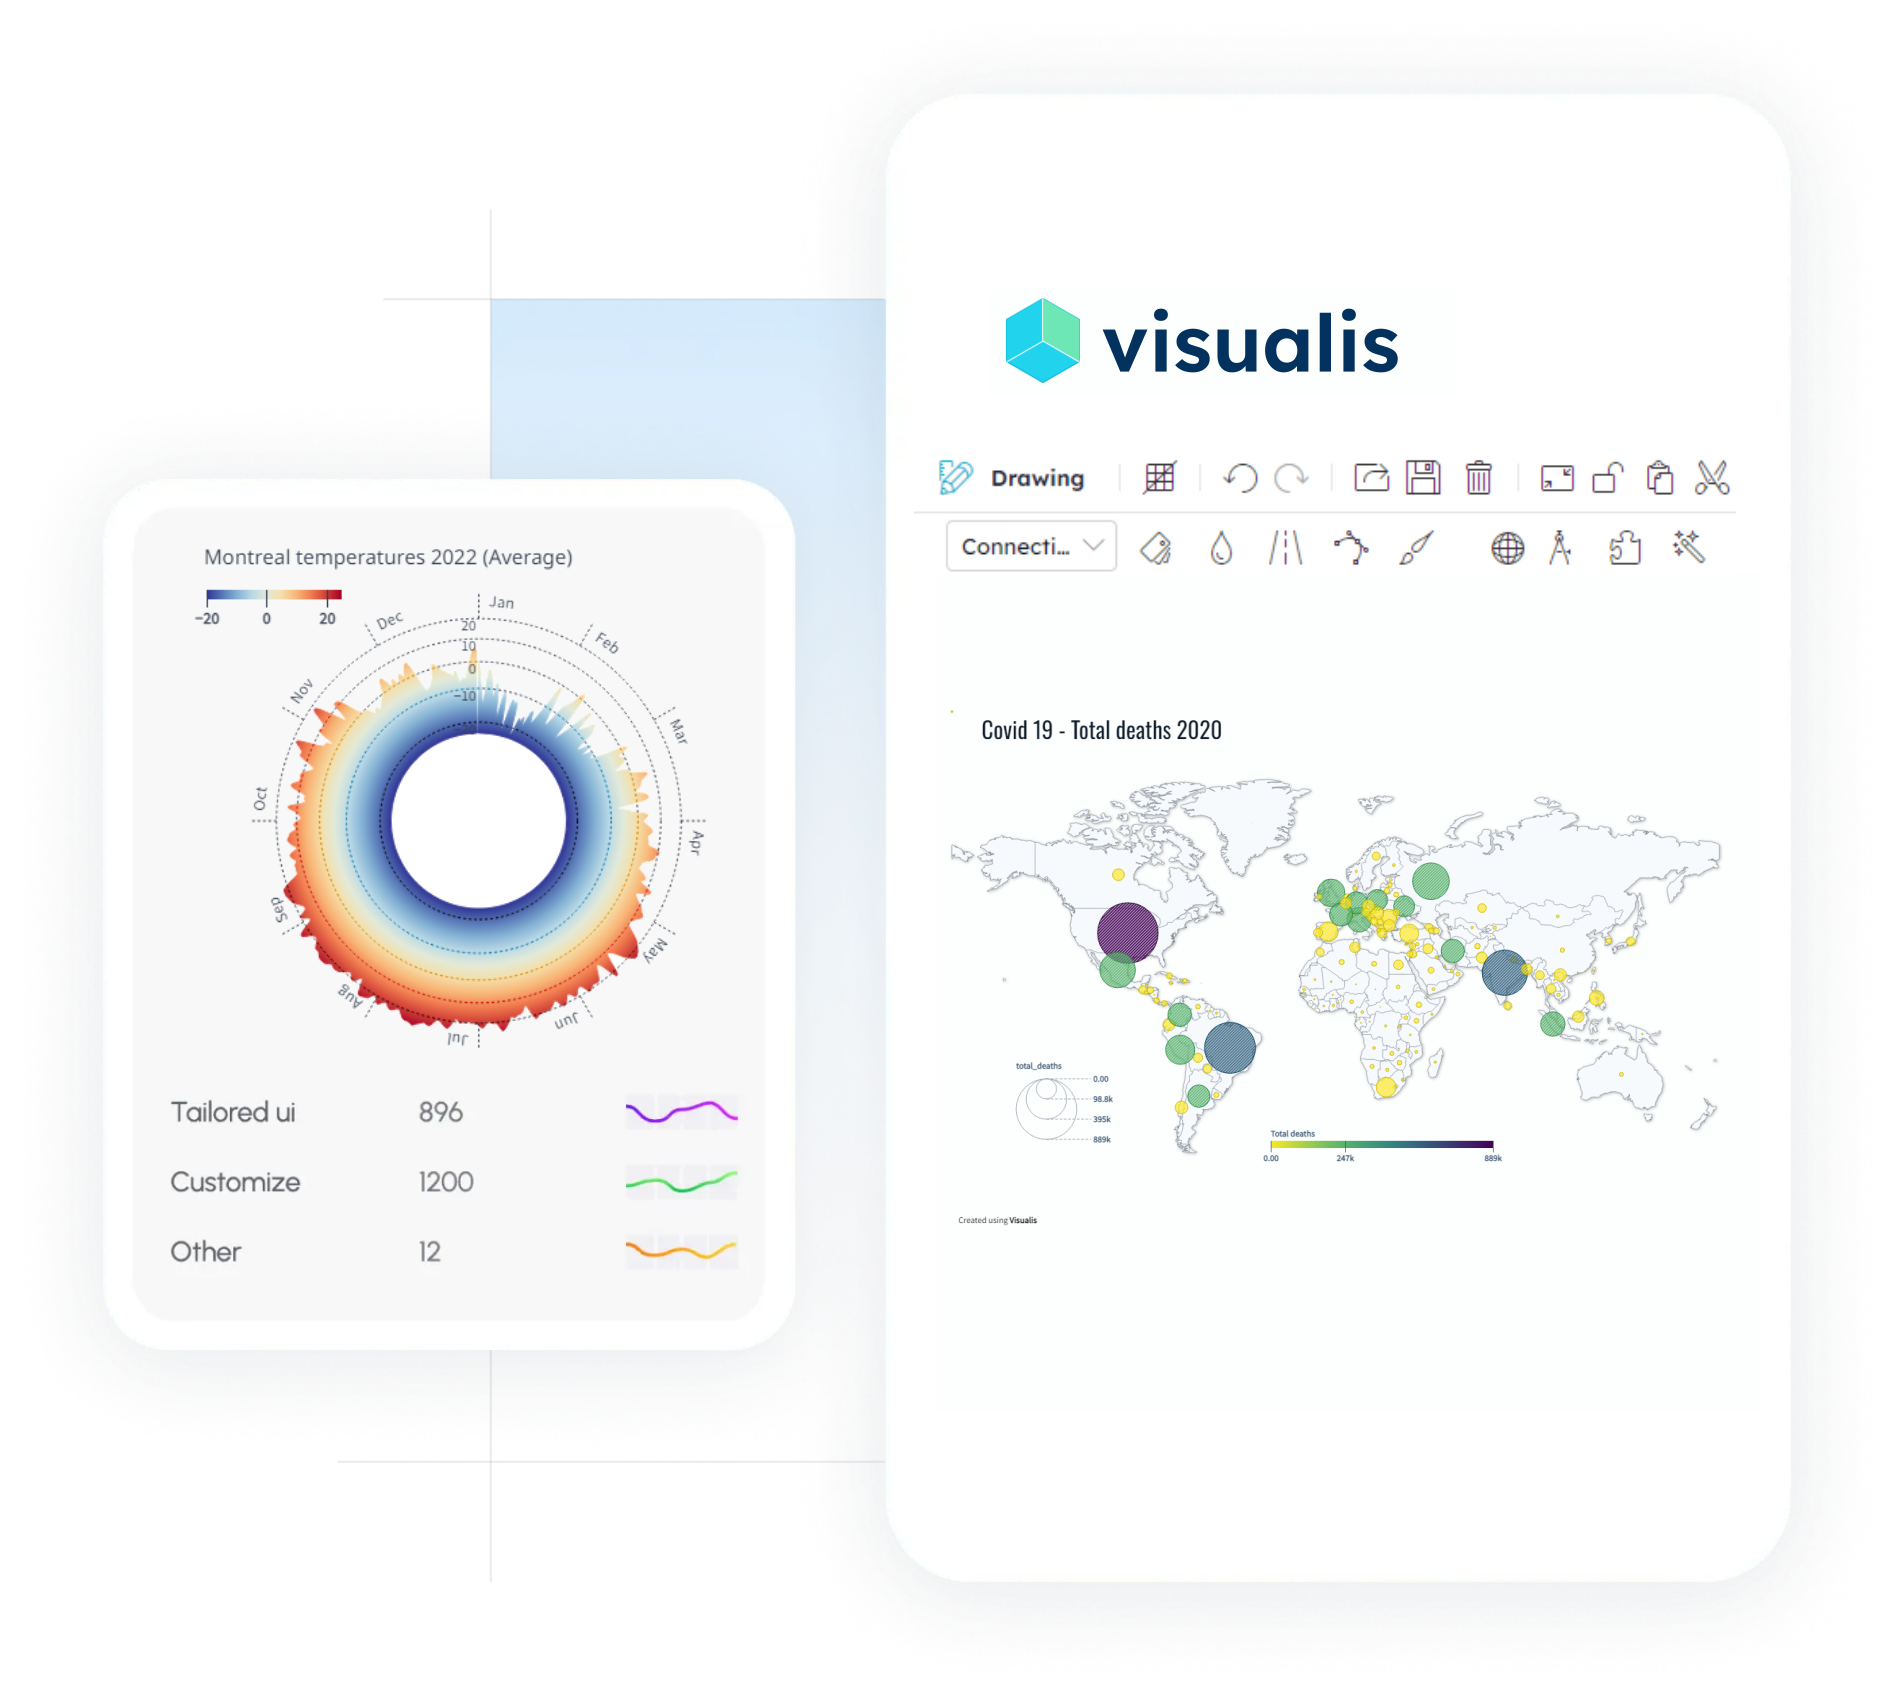
Collaborative dataVisualization
With visualis, simplicity is the goal, so you don’t have to be a designer to tell your story. Data from diverse sources can be imported, transformed, and visualized easily, using maps, charts, tables and many other infographics shapes and forms.
Create and share appealing stories using maps, charts and infographics
From working on a design individually, to collaborating with your team, to sharing with your audience, all is there for you to create and share stories and reports in visualis.
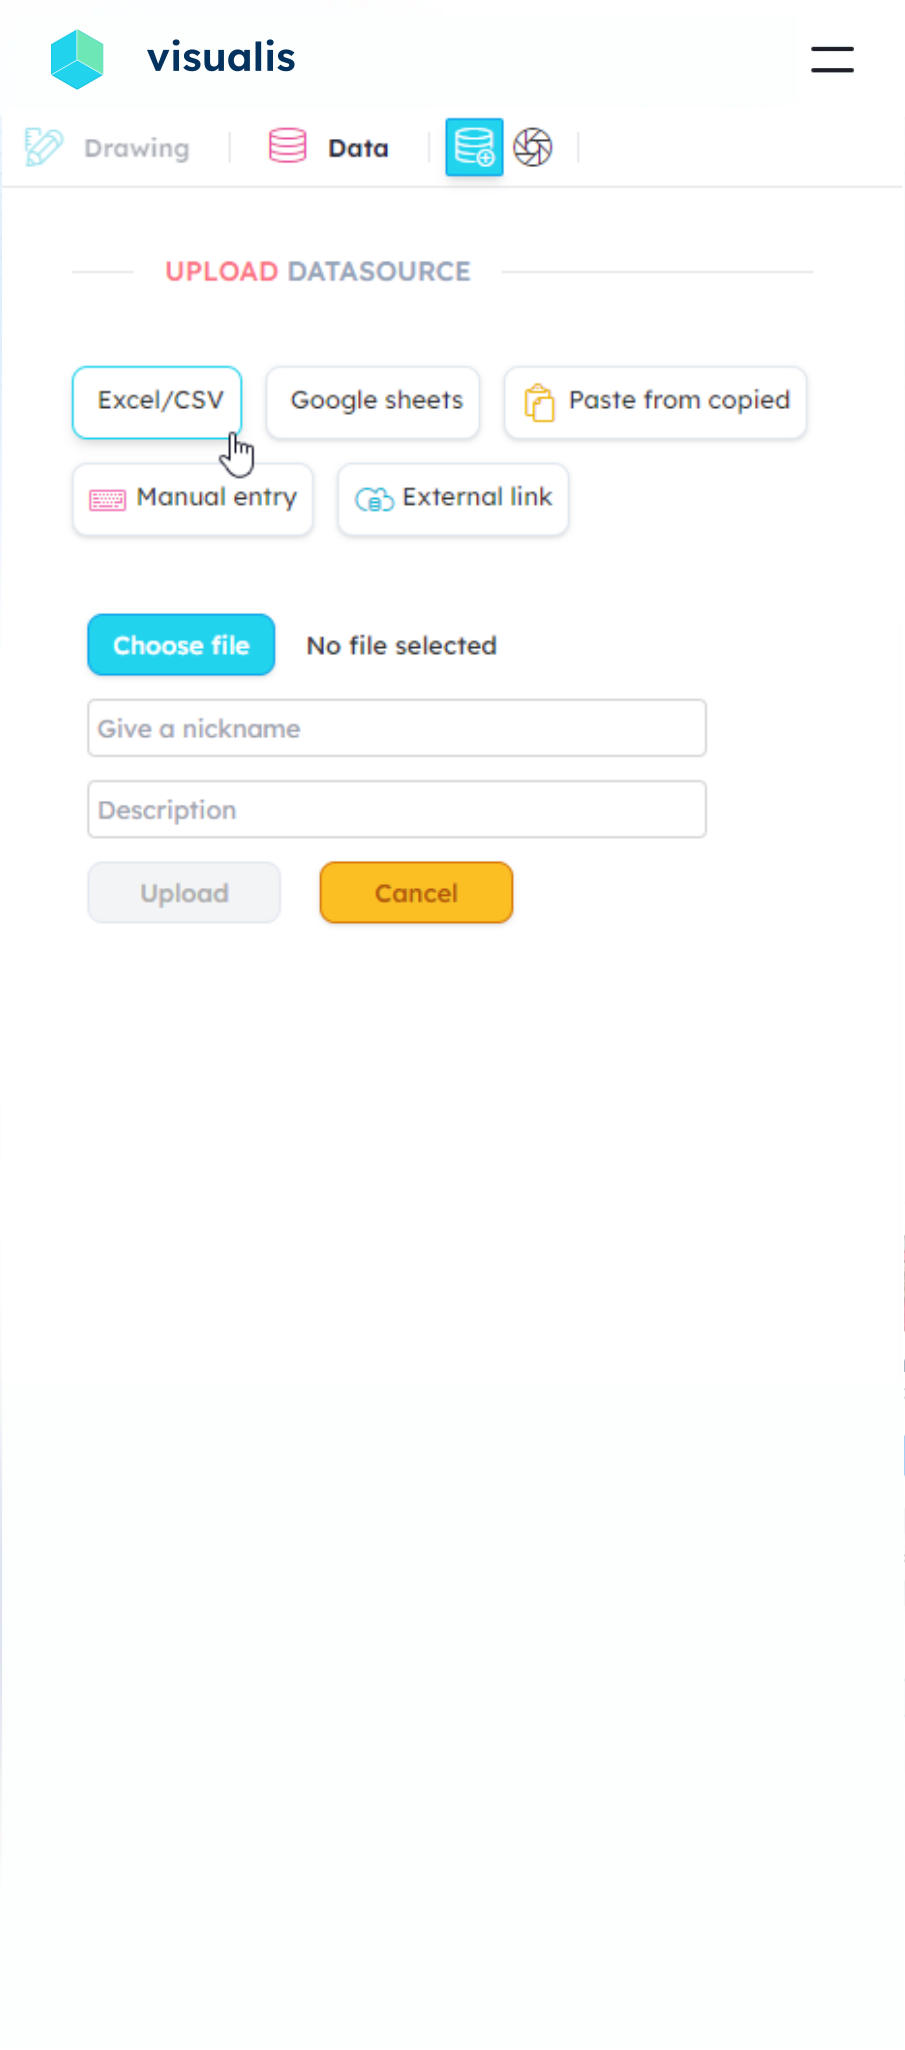
Upload, Link and prepare your data
With visualis you will be able to upload your data in csv frmat, link from an external spreadsheet, paste from clipboard, or type in directly from keyboard.

Transform your data
If your data is not in the layout/format you expect, you can transform it by using filters, grouping and/or pivoting.

Link to visualization
Link your data to your chart/map/infographic by assigning data columns to "dimensions".
Design as a pro with no effort
Every component has a set of properties grouped in categories like: Style, Layout, Datum and Effects, allowing you to style as a professional.

Styling is easy
Every component can be stylized using colors, ramps, strokes, fonts, and even filter effects, giving a professional looking in your visualizations.

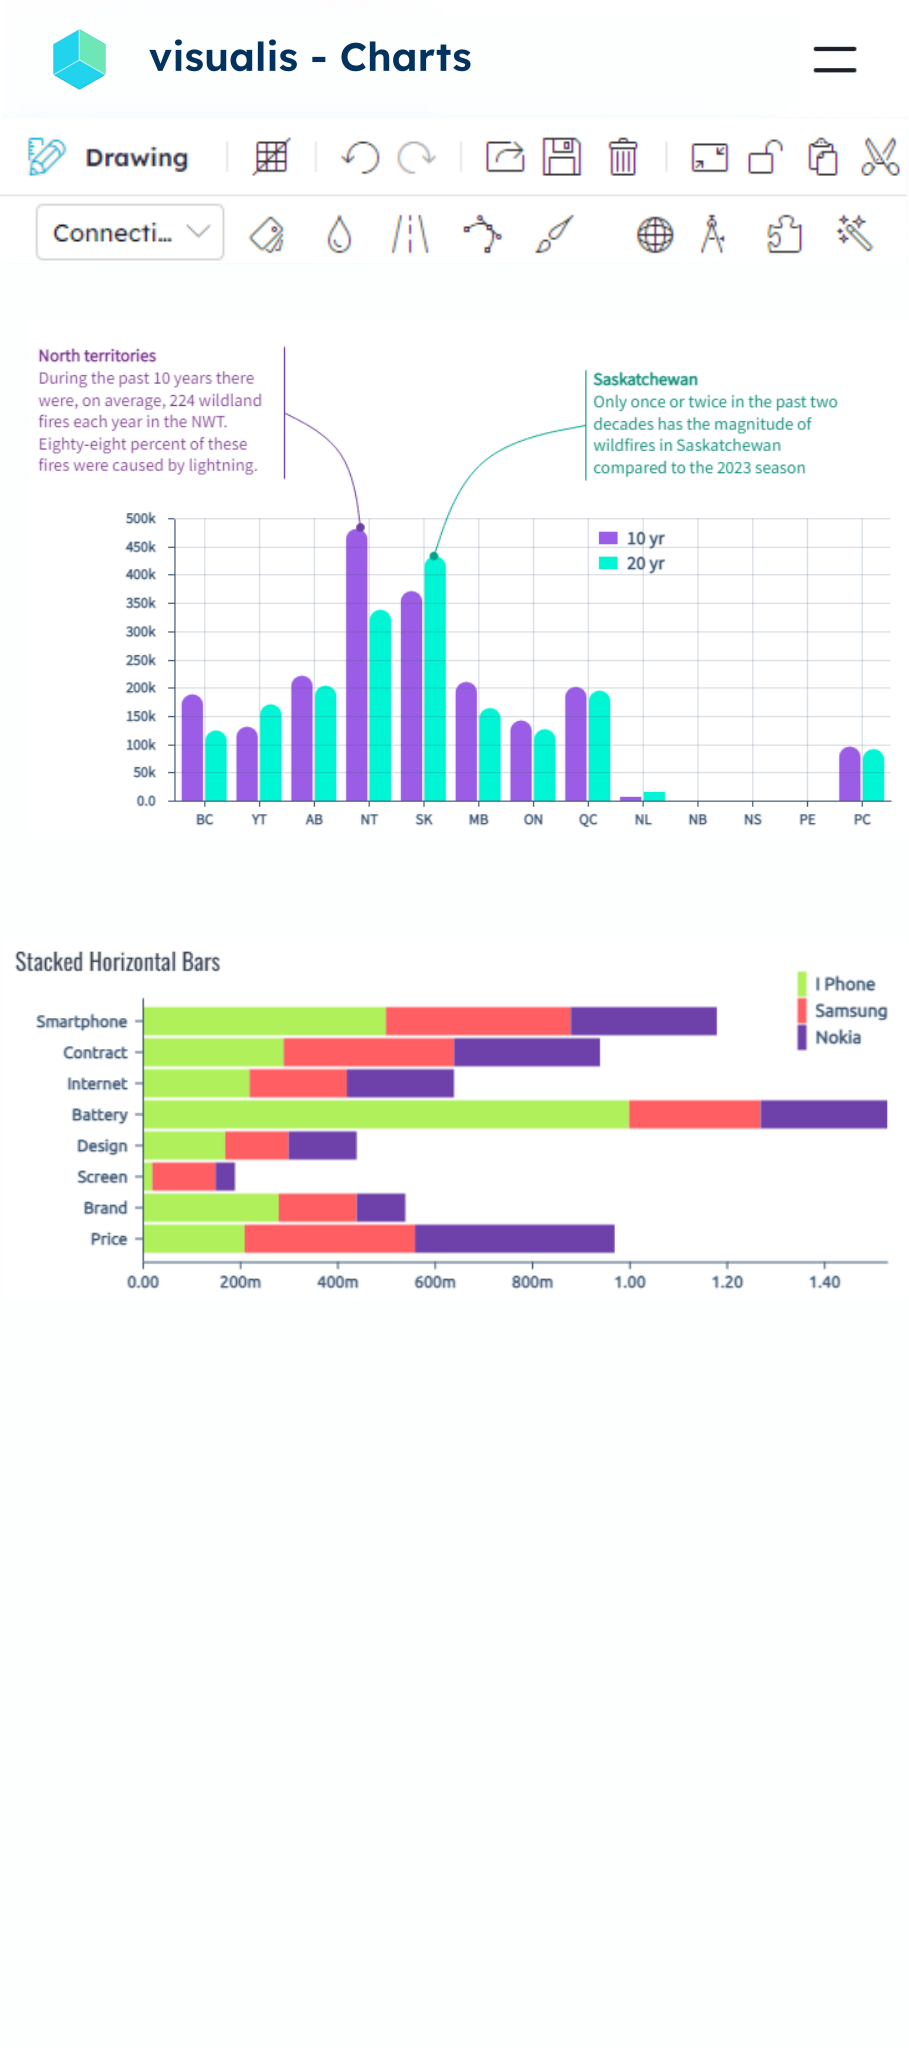
Annotate
Each chart, map or infographic can be annotated to highlight points, or areas of data that are not perceptible to the naked eye.
Share with your audiense
Several options and formats allowing you to share your visualizations

Share
Your visualizations can be shared across your team, allowing other members to participate in your design.

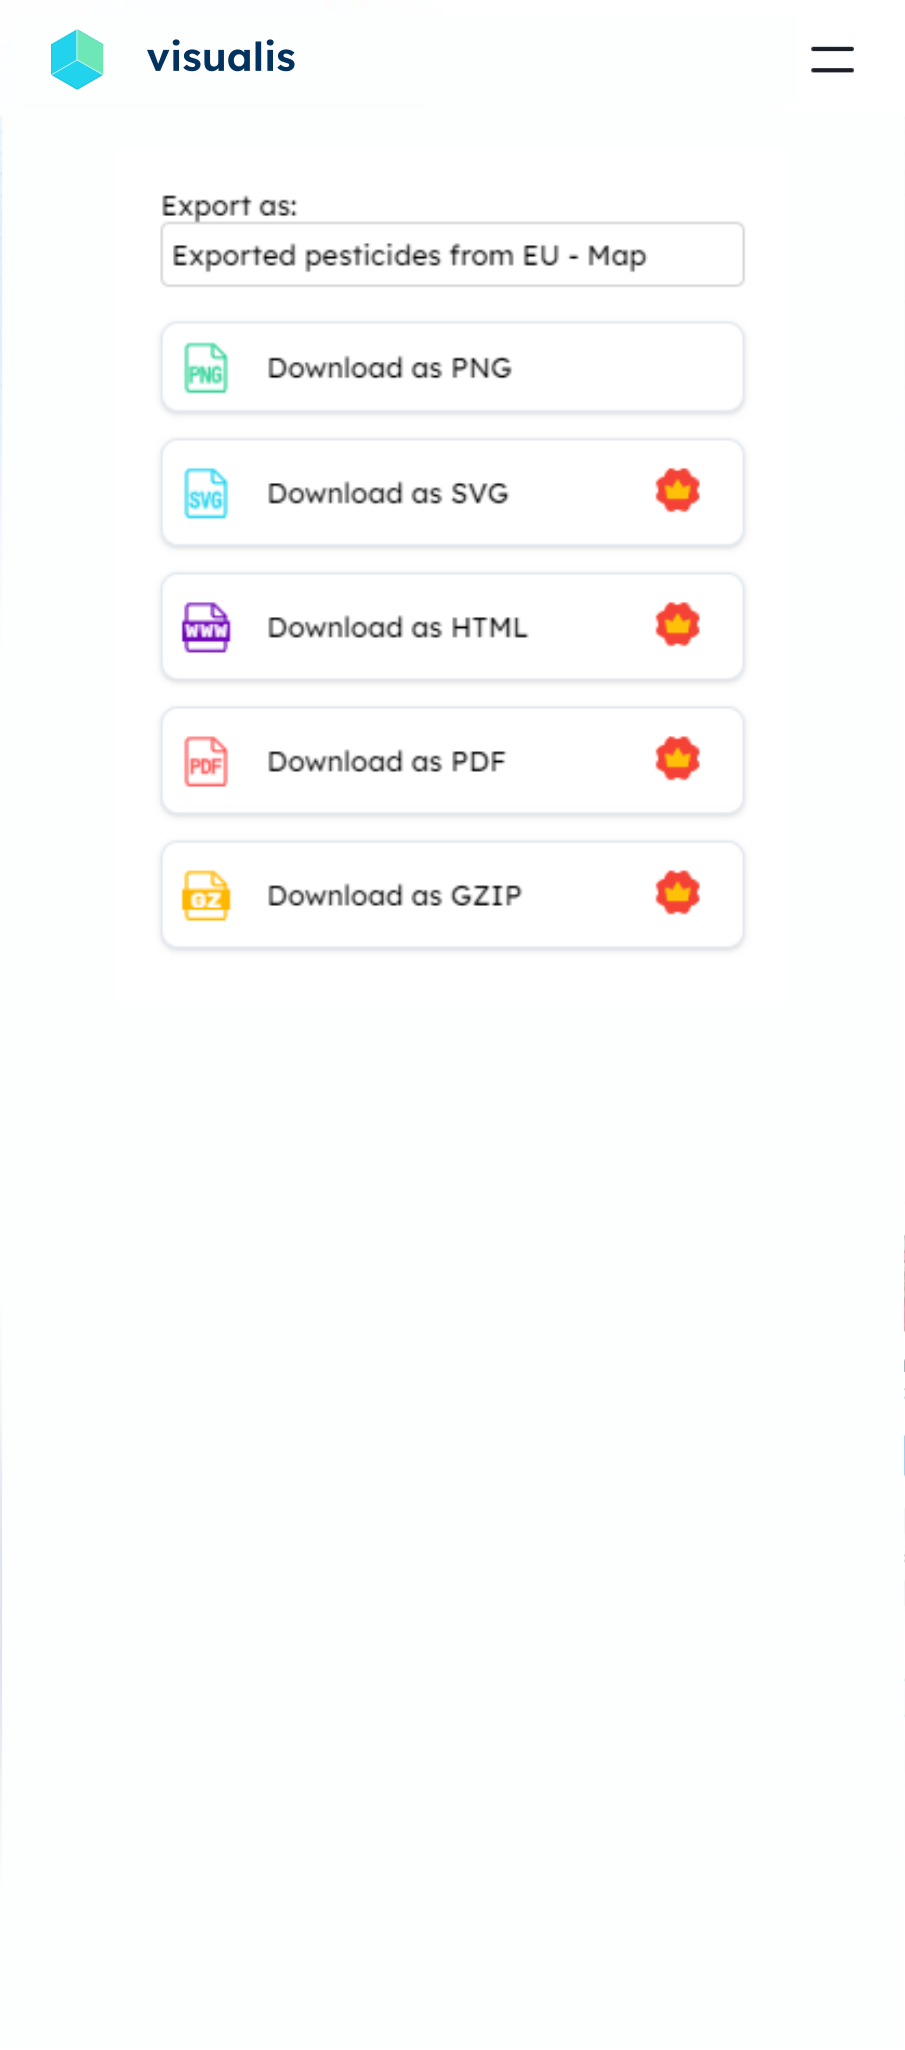
Export
Visualizations can be exported to several formats, like pdf, png, svg, html, or Gzip.
Three groups of features
Maps, Charts and Infographics & shapes, all of them with a wide range of visual cappabilities, flexibility and customization.
Maps
Six interactive, customizable and data binded map types allowing you to create beautiful geographic representations, from Choroplets, Proportional Symbols, Link Connections, Gridded points, Hex-Bins and Cartograms
Charts
Twenty or more customizable and data binded chart types. Ranging from simple lines, bars and areas, to specialized charts like Radial areas, Pyramids, Bullets, Gant, Voronoi tree maps and Quadrant
Infographics & shapes
A hand crafted set of data binded infographics and static shapes allows you to add visual content to your stories.
Help people to create and tell stories
At Visualis we believe everyone should be able to create beautiful and appealing content with no design experience and minimal effort.
Our mission is to provide clarity and insight in a world of complex and diverse information. With our tool, we aim to empower individuals and businesses to effortlessly transform raw data into meaningful visual representations.
A pricing for every need
Start creating visualizations today with powerful free and paid plans.

Free
For individuals
- ✓ Create & publish visualizations
- ✓ (Upload) 3 Datasources
- ✓ Export visualizations as PNG

Teams
For professionals and teams
All the features of the free plan plus: